Press and data room · free for editorial use with credit
Figures, charts and data on the AI build-out
Everything on this page comes from companies’ own SEC filings and is free for journalists, researchers and commentators to quote and republish with credit: citable figures with their sources, charts you can embed, and the datasets behind the AI stack map as CSV files. Financial data last pulled October 30, 2026.
Key figures
Each sentence can be quoted as written. The link leads to the page with the full context, the chart and the method; please link to it when you cite the figure.
$566B
Microsoft, Amazon, Alphabet, Meta and Oracle spent $566B on capital projects in the four quarters to Q2 2026, up from $184B two years earlier.
Source and context →97%
Those five companies spent 97% of their operating cash flow on capex in Q2 2026, against 35% in Q3 2023.
Source and context →83%
Of the extra gross profit AI suppliers earned over two years, 83% went to chip and memory makers; server makers kept 14% of their extra revenue as gross profit.
Source and context →$1.11T
Microsoft, Meta, Oracle, Alphabet and CoreWeave disclose $1.11T of data-center leases signed but not yet started, which appear in neither capex nor the balance sheet.
Source and context →5.0× vs 2.2×
From Q1 2023 to Q2 2026, the five buyers’ quarterly capex grew 5.0×, while revenue at AWS, Microsoft Cloud and Google Cloud grew 2.2×.
Source and context →25
SEC filings disclose 25 financing links between AI suppliers and their customers, including Nvidia’s equity investments and lease guarantees, Amazon’s credit facility for Anthropic and AMD’s customer warrants.
Source and context →
Charts to embed
Each chart is a 1200 × 675 PNG with its title, source and credit printed on it, so it stays attributed wherever it appears. Download it, or paste the embed code to show the latest version: the images are rebuilt each time the data is refreshed.
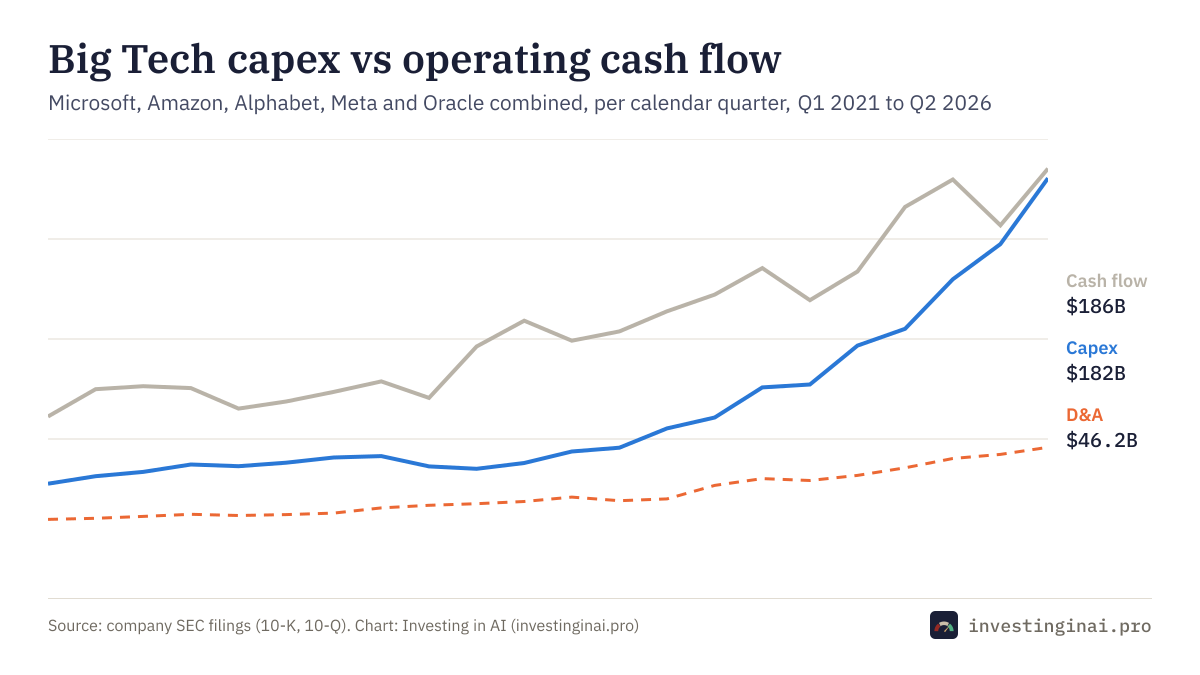
Big Tech capex vs operating cash flow
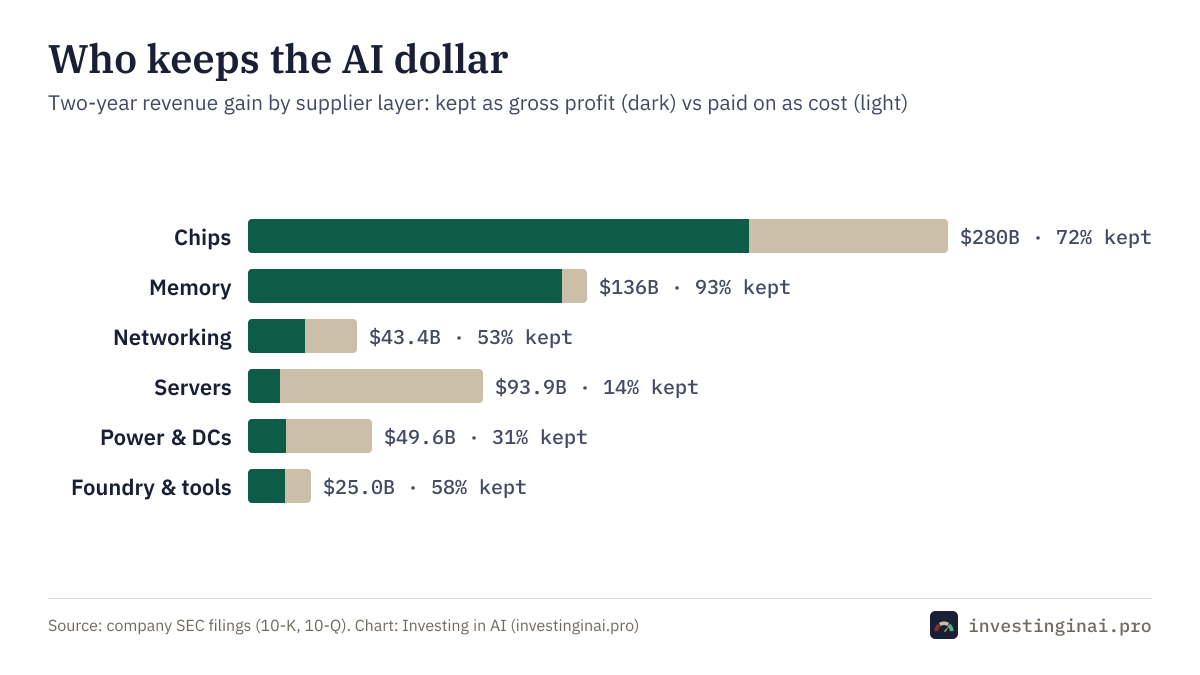
Who keeps the AI dollar
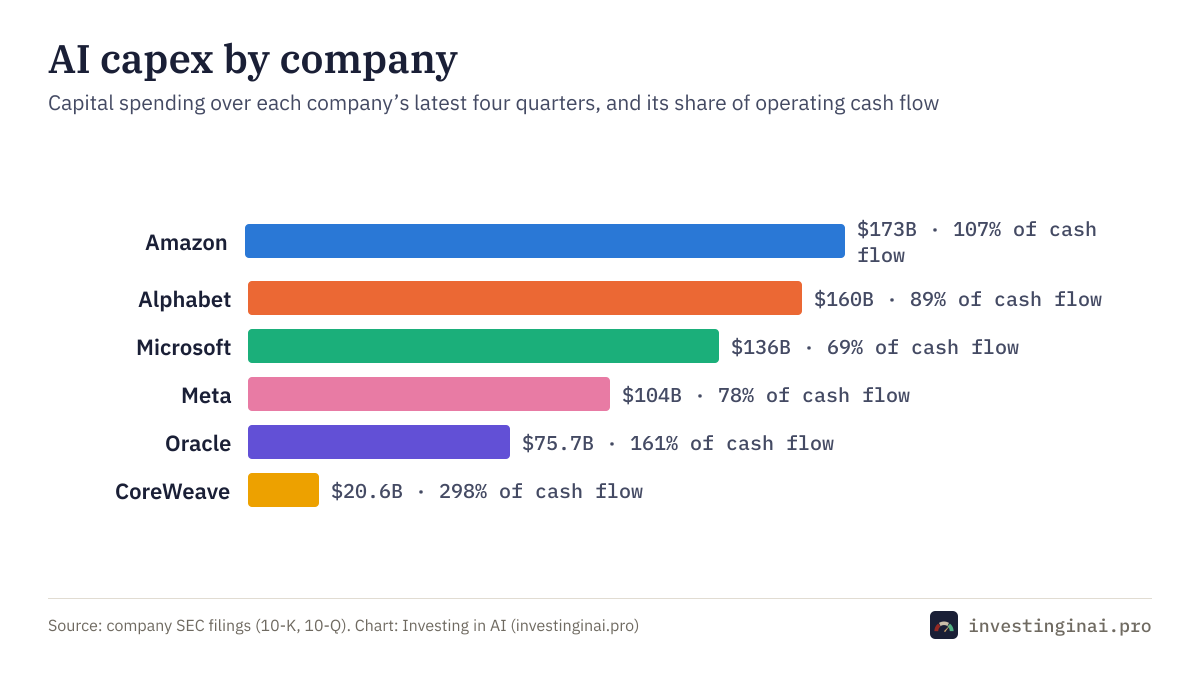
AI capex by company
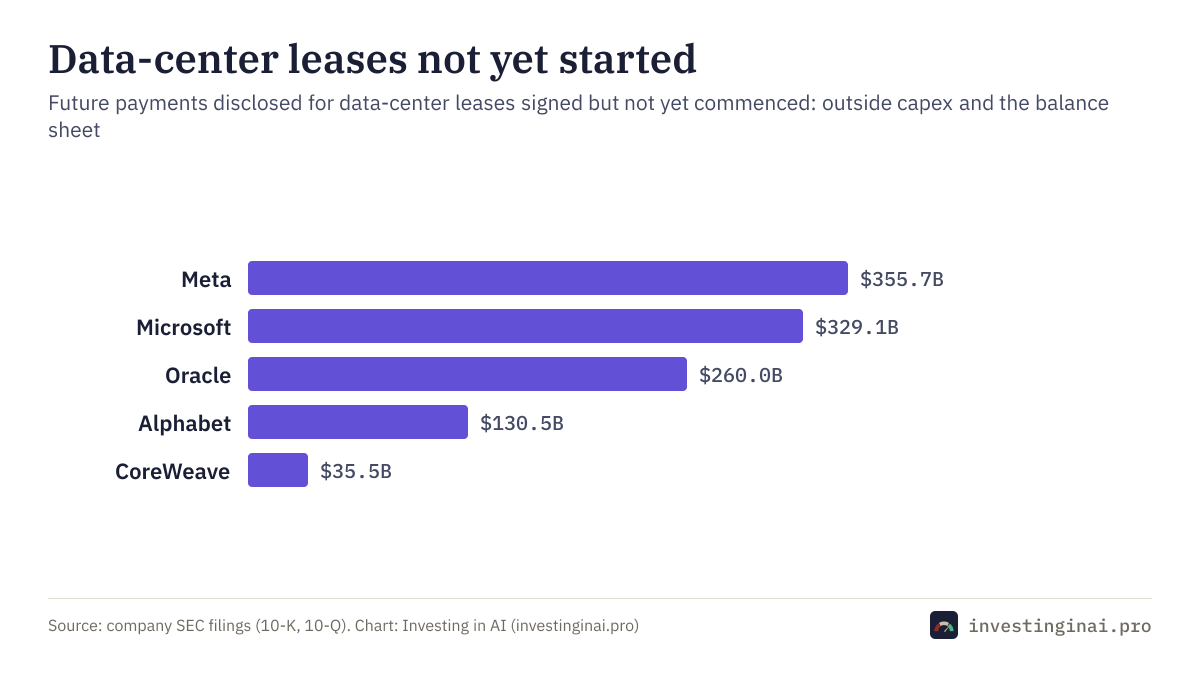
Data-center leases not yet started
Datasets
The data behind the AI stack pages, as CSV files with one header row. Dollar amounts are in millions unless the column says otherwise; ratios are decimals (0.25 means 25%). Quarters are aligned to the nearest calendar quarter, and each row keeps the company’s own fiscal period end so you can trace it back to the filing.
AI capex by quarter
Download CSVQuarterly capital spending, operating cash flow and depreciation for Microsoft, Amazon, Alphabet, Meta, Oracle and CoreWeave, aligned to calendar quarters. $ millions.
ai-capex-by-quarter.csv · 124 rows · 8 columns
Columns
calendar_quarter, ticker, company, fiscal_period_end, capex_usd_m, operating_cash_flow_usd_m, depreciation_amortization_usd_m, revenue_usd_m
Explained on capex tracker.
Cloud segment revenue
Download CSVQuarterly revenue at AWS, Microsoft Cloud, Google Cloud and Oracle cloud infrastructure, plus AWS, Google Cloud and Intelligent Cloud operating income, from segment disclosures. $ millions.
cloud-segment-revenue.csv · 117 rows · 5 columns
Columns
calendar_quarter, series, fiscal_period_end, value_usd_m, filing_accession
Explained on follow the money.
AI supplier segment revenue
Download CSVQuarterly segment revenue for Nvidia Data Center (and its hyperscale / AI-cloud split), AMD Data Center, Broadcom Semiconductor Solutions, Marvell data center, Intel Data Center and AI, Micron DRAM, Dell infrastructure and AI servers, and HPE servers. $ millions.
ai-supplier-segments.csv · 130 rows · 6 columns
Columns
calendar_quarter, ticker, series, fiscal_period_end, value_usd_m, filing_accession
Explained on chips.
AI stack companies
Download CSVEvery company on the AI stack map with its layer and latest trailing-twelve-month figures (latest fiscal year for 20-F filers): revenue, growth, margins, capex, cash flow and backlog. Values in the currency reported; $ millions for USD.
ai-stack-companies.csv · 91 rows · 14 columns
Columns
ticker, company, layer, basis, period_end, currency, revenue_m, revenue_growth_yoy, gross_margin, operating_margin, capex_m, operating_cash_flow_m, free_cash_flow_m, remaining_performance_obligations_m
Explained on the AI stack map.
AI stack layer totals
Download CSVFor each of the eight layers: combined trailing revenue, revenue two years earlier, the gain, gross profit kept from the gain, and gross and operating margins. US filers with at least $100M of revenue. $ millions.
ai-stack-layer-totals.csv · 8 rows · 9 columns
Columns
layer, companies, revenue_ttm_m, revenue_two_years_earlier_m, revenue_gain_m, gross_profit_gain_m, gross_margin, gross_margin_two_years_earlier, operating_margin
Explained on follow the money.
AI money loop: disclosed financing links
Download CSVEvery investment, guarantee, purchase commitment, revenue link, customer warrant and power contract between AI companies that a filing states as fact, with the quoted sentence and a link to the filing.
ai-money-loop-links.csv · 25 rows · 12 columns
Columns
id, from, to, kind, summary, usd_m, filer, form, period, filed, filing_url, quote
Explained on circular financing.
Data-center leases signed but not yet started
Download CSVFuture lease payments the largest buyers disclose for data-center leases that have not commenced (outside capex and the balance sheet), with the quoted sentence and filing.
ai-data-center-leases.csv · 5 rows · 6 columns
Columns
company, usd_m, period, filed, filing_url, quote
Explained on follow the money.
How to cite
In text: “according to an Investing in AI analysis of SEC filings”, linked to the page the figure comes from. In a chart or table credit: Source: Investing in AI (investinginai.pro), from SEC filings. For a dated figure that should not change, cite the quarterly AI Stack Report for that quarter rather than the live pages, which update with each data refresh.
Please describe the figures as what they are. Capex is cash paid for property and equipment and leaves out finance leases. Layer totals cover the companies on our map, not whole industries. Financing links are what filings state; we don’t estimate undisclosed deals. If a figure you need isn’t here, ask: we would rather provide the right cut than see the wrong one used.
Terms of use
The charts, datasets and figures on this page are published under CC BY-NC 4.0, a non-commercial licence: you may copy, republish and adapt them for non-commercial purposes, as long as you credit Investing in AI and link to the source page. In addition, we permit editorial use: news reporting, commentary, research and teaching may quote and republish the charts and figures with that credit, including in commercial publications such as newspapers, magazines and newsletters.
Commercial use beyond that, such as building the data into a product, a paid research or data service, or a trading or advisory tool, or reselling it, needs a licence; ask us. The underlying company filings are public records on SEC EDGAR; quoted sentences are the companies’ own words, reproduced so readers can check our reading. The material is provided as is and is not investment advice.
Method in brief
- Sources: 10-K and 10-Q filings (XBRL financial data and segment disclosures) for US filers; annual 20-F reports for TSMC, ASML, ASE, Arm and Nebius.
- Trailing figures are the latest four reported quarters; growth compares them with the four before. Fiscal quarters are aligned to the nearest calendar quarter before anything is added up.
- Layer totals add the companies on each layer page with at least $100 million of trailing revenue; foreign filers are shown but kept out of quarterly totals.
- Financing links and lease disclosures are kept only when the filing’s own sentence contains the figures; each row carries the quote and the filing URL.
- Full method: the AI stack map and following the money.
About Investing in AI
Investing in AI is Rob May’s book and newsletter on telling AI moats from traps, and the research behind this site: the AI stack map, the money loop, the quarterly AI Stack Report and the AI Signal Gauge, all built from SEC filings. It is run by Rob May and Vik Chadha.

Rob May
Co-founder and CEO of Neurometric, which optimizes inference for multi-model AI systems. He co-founded HalfCourt Capital, which has invested only in AI since 2015, built Backupify with Vik before its acquisition by Datto, and is the author of the book Investing in AI.
Download headshot
Vik Chadha
Founder and CEO of Scalable Ventures, a venture lab building AI-native B2B software. He co-founded UnifyCX in 2002, growing it to more than 6,000 employees, later co-founded Backupify with Rob, invests as a general partner at Unbridled Ventures, and sits on the board of VentureFirst.
Download headshot
Logo: PNG, 512 × 512 · SVG

Media contact
For interviews, comment, a custom data cut or a question about a figure, use the contact form and choose “Media or podcast”. Tell us your deadline; we read every message ourselves.
Free · quarterly · from SEC filings
Get new data with each quarterly report
After each Big Tech earnings season we update the map from the new filings and publish what changed: who spent, who got paid, who kept it and what the filings reveal about the loop. Free, in Rob May’s Investing in AI newsletter.
Form not showing? Subscribe on Substack. No spam; unsubscribe any time.
Questions from journalists
Can I use these charts and figures in an article?
Yes. News reporting, commentary, research and teaching may quote and republish the charts, figures and data with credit to Investing in AI and a link to the source page, including in commercial publications. Other uses are under CC BY-NC 4.0 (non-commercial); for commercial products or data resale, ask us about a licence.
Can I use the data in a commercial product?
Not under the free licence. Using the datasets or charts in a product, a paid research service, a trading or advisory tool, or reselling them needs a commercial licence. Tell us what you have in mind through the work-with-us page and choose “Custom research or data”.
How should I credit Investing in AI?
As “Investing in AI analysis of SEC filings”, with a link to investinginai.pro or to the page the figure comes from. For a chart, the credit is already printed on the image; please keep it visible.
Where does the data come from?
From companies’ 10-K, 10-Q and 20-F filings with the SEC: XBRL financial data, segment disclosures, and quoted sentences for financing links and lease commitments. No estimates, consensus figures or paid data are used, and every link and lease figure carries the filing it came from.
How current are the numbers?
The financial data was last pulled from SEC filings on October 30, 2026, and the financing links on October 30, 2026. Downloads and charts are rebuilt whenever the data is refreshed, normally after each earnings season. For a fixed quarter, cite the dated AI Stack Report instead.
Can I get a custom cut of the data or speak to the authors?
Yes. Rob May and Vik Chadha are available for interviews and comment on AI capital spending, the economics of the AI stack and how to read AI companies from their filings, and can provide custom data cuts. Use the contact form on the work-with-us page and choose “Media or podcast”.
Are the figures investment advice?
No. They report what companies disclosed and what it shows about the AI build-out. Nothing here recommends buying or selling a security.
Research and education, not investment advice: nothing here is a recommendation to buy or sell any security. Figures come from companies’ SEC filings as reported; companies named were chosen because they show how the stack works, not as a view on their shares.